Evolution of the number of housing of Le Bignon
History of housing of Le Bignon from 1968 to 2007 :
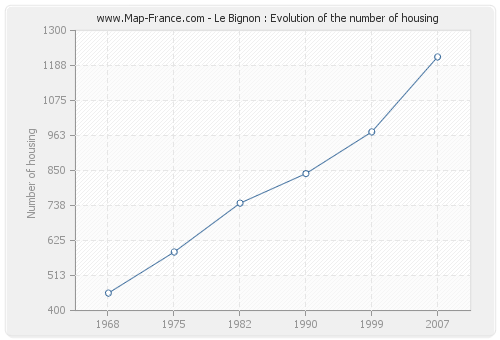
The number of housing of Le Bignon was 1 215 in 2007, 974 in 1999, 840 in 1990, 745 in 1982, 588 in 1975 and 456 in 1968.
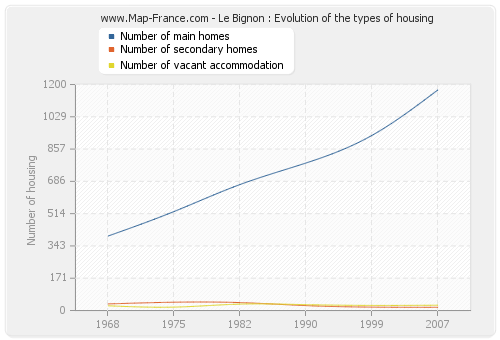
In 2007 the accommodations of Le Bignon consisted of 1 170 main homes, 17 second homes and 28 vacant accommodations.
The following graphs show the history of the number and the type of housing of Le Bignon from 1968 to 2007. The second graph is drawn in cubic interpolation. This allows to obtain more exactly the number of accommodation of the city of Le Bignon years where no inventory was made.
|
Housing of Le Bignon from 1968 to 2007 :
- Housing of Le Bignon in 2007 : 1 215
- Housing of Le Bignon in 1999 : 974
- Housing of Le Bignon in 1990 : 840
- Housing of Le Bignon in 1982 : 745
- Housing of Le Bignon in 1975 : 588
- Housing of Le Bignon in 1968 : 456
|
Number of housing of Le Bignon group by types from 1968 to 2007 :
- Number of main homes of Le Bignon in 2007 : 1 170
- Number of main homes of Le Bignon in 1999 : 929
- Number of main homes of Le Bignon in 1990 : 783
- Number of second homes of Le Bignon in 2007 : 17
- Number of second homes of Le Bignon in 1999 : 18
- Number of second homes of Le Bignon in 1990 : 26
- Number of vacant housing of Le Bignon in 2007 : 28
- Number of vacant housing of Le Bignon in 1999 : 27
- Number of vacant housing of Le Bignon in 1990 : 31
|
Housing of Le Bignon
|
Housing evolution of Le Bignon from 1968 to 2007
|
Number of housing of Le Bignon per inhabitants
History of the number of housing of Le Bignon per inhabitants :
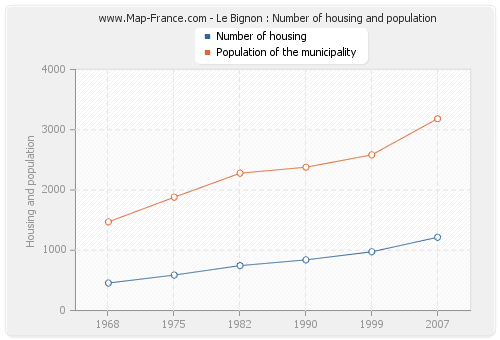
The population of Le Bignon was 3 184 inhabitants in 2007, 2 583 inhabitants in 1999, 2 378 inhabitants in 1990, 2 279 inhabitants in 1982, 1 880 inhabitants in 1975 and 1 471 inhabitants in 1968. Meanwhile, the number of housing of Le Bignon was 1 215 in 2007, 974 in 1999, 840 in 1990, 745 in 1982, 588 in 1975 and 456 in 1968.
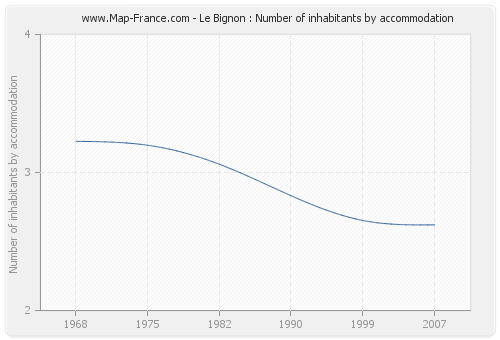
The number of inhabitants of Le Bignon per housing was 2,62 in 2007.
|
Population of Le Bignon from 1968 to 2007 :
- Population of Le Bignon in 2007 : 3 184 inhabitants
- Population of Le Bignon in 1999 : 2 583 inhabitants
- Population of Le Bignon in 1990 : 2 378 inhabitants
- Population of Le Bignon in 1982 : 2 279 inhabitants
- Population of Le Bignon in 1975 : 1 880 inhabitants
- Population of Le Bignon in 1968 : 1 471 inhabitants
|
Number of inhabitants per housing of Le Bignon :
- Number of inhabitants per housing of Le Bignon in 2007 : 2,62
- Number of inhabitants per housing of Le Bignon in 1999 : 2,65
- Number of inhabitants per housing of Le Bignon in 1990 : 2,83
- Number of inhabitants per housing of Le Bignon in 1982 : 3,06
- Number of inhabitants per housing of Le Bignon in 1975 : 3,20
- Number of inhabitants per housing of Le Bignon in 1968 : 3,23
|
Number of inhabitants and housing of Le Bignon
|
Number of inhabitants per housing of Le Bignon
|
Type of accommodation of Le Bignon
The accommodation of Le Bignon in 2007 consisted of 1 173 houses and 39 flats.
Here are below the graphs presenting the statistics of housing of Le Bignon.
|
Type of housing of Le Bignon in 2007 :
- Number of houses of Le Bignon in 2007 : 1 173
- Number of apartments of Le Bignon in 2007 : 39 |
Number of rooms of main homes of Le Bignon in 2007 :
- Number of main homes of Le Bignon of 1 room : 3
- Number of main homes of Le Bignon of 2 rooms : 61
- Number of main homes of Le Bignon of 3 rooms : 164
- Number of main homes of Le Bignon of 4 rooms : 164
- Number of main homes of Le Bignon of 5 rooms and more : 647 |
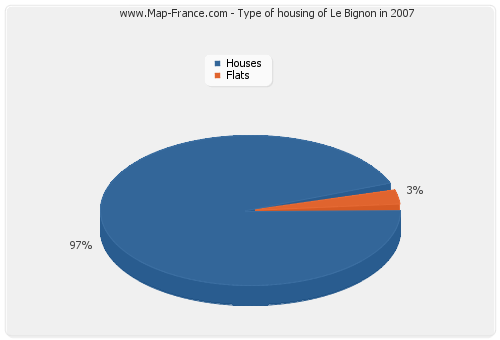
Type of housing of Le Bignon in 2007
|
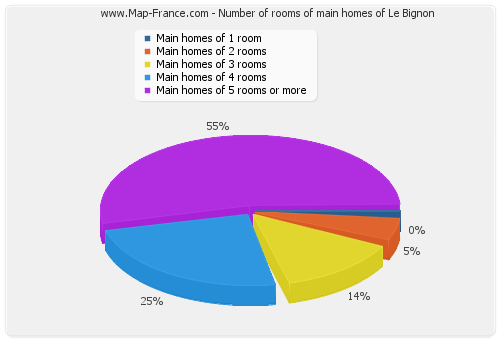
Number of rooms of main homes of Le Bignon
|
Type of housing of Le Bignon
|
In 2007, 957 main homes of Le Bignon were occupied by owners. Meanwhile, 1 170 households lived in the city of Le Bignon. The following graphs present the statistics of these households of Le Bignon.
|
Moving in date of the households of Le Bignon (2007 data):
- Number of households of Le Bignon having moved for less than 2 years : 101
- Number of households of Le Bignon having moved between 2 and 5 years : 214
- Number of households of Le Bignon having moved between 5 and 9 years : 250
- Number of households of Le Bignon having moved for 10 years or more : 605 |
Type of housing of the main homes of Le Bignon in 2007 :
- Number of main homes of Le Bignon occupied by owners : 957
- Number of main homes of Le Bignon occupied by tenants : 207
- Number of main homes of Le Bignon occupied free of charge : 6 |
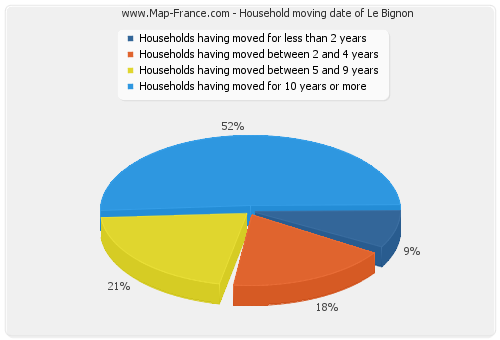
Household moving date of Le Bignon
|
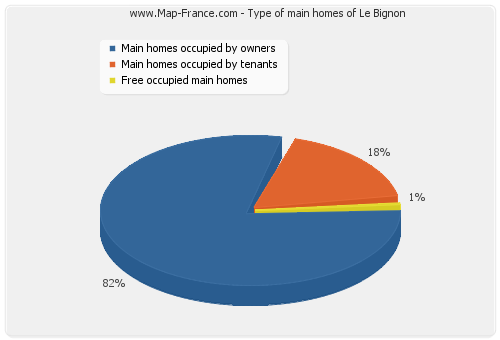
Type of main homes of Le Bignon
|
|
